
Reading US CPI & Core Inflation in Japan, Korea, Taiwan
Each country strips different items from core inflation, so September 2026's US core CPI (2.6%) and Japan's core (2.1%) aren't like for like.
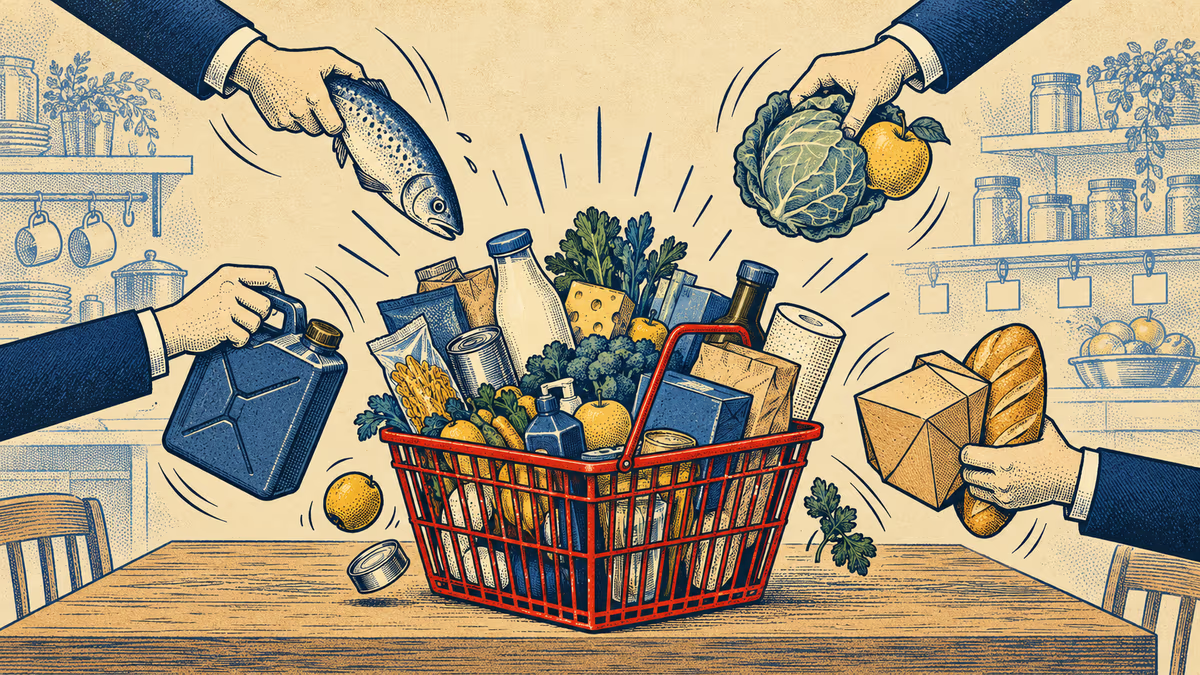
Japan's "core" inflation still includes energy. US core CPI drops even restaurant meals. In South Korea, the index excluding agricultural products and oil removes only petroleum products from energy, by definition. For September 2026, core readings in all four economies landed between 2.1% and 2.8%. That's based on releases from the US Bureau of Labor Statistics (BLS), the Statistics Bureau of Japan, Korea's Ministry of Data and Statistics and Taiwan's Directorate-General of Budget, Accounting and Statistics (DGBAS). Because each one leaves out different items, a side-by-side comparison blends real price gaps with definitional ones.
This guide is current as of October 31, 2026. We'll update the numbers in November 2026, when October data come out in all four economies. We'll also update it when Korea rebases its index (results are planned for December 18), then review it every quarter.
Here are the definitions in one table. The ① and ② markers number the two core-type gauges where a country publishes both. New to core inflation? Start with our beginner's guide to interest rates, exchange rates and inflation.
Table 1. Core inflation definitions by country
| Item | United States | Japan | Korea | Taiwan |
|---|---|---|---|---|
| Statistics agency | Bureau of Labor Statistics (BLS) | Statistics Bureau of Japan (Ministry of Internal Affairs and Communications) | Ministry of Data and Statistics | Directorate-General of Budget, Accounting and Statistics (DGBAS) |
| Core measure | All items less food and energy | ① All items excluding fresh food (生鮮食品を除く総合), the "core" ② All items excluding fresh food and energy (生鮮食品及びエネルギーを除く総合) | ① Index excluding agricultural products and oil ② Index excluding food and energy | Core CPI (核心CPI) |
| What's excluded | Food (at home and away from home), energy | ① Fresh fish and seafood, vegetables, fruit ② ① plus energy | ① Agricultural products other than grains; petroleum products ② ① plus fishery products, livestock products, energy | Vegetables and fruit, then energy |
| Watch out for | Restaurant meals are excluded too | ① keeps energy and meat | ① keeps grains, electricity and gas (by definition) | Food other than vegetables and fruit stays in |
| Central bank target | Headline PCE, 2% | Consumer prices, 2% year on year | Consumer prices, 2% year on year | No numerical target stated (price-stability mandate, per the September 17, 2026 board resolution) |
| Base year | 1982-84=100 (most series) | 2025=100 | 2020=100 (rebasing underway) | 2021=100 |
The country differences come down to two rows: "What's excluded" and "Watch out for." Readings and release dates go out of date, so they get their own table below. "Headline" refers to the all-items index.
Table 2. September 2026 readings and October release dates
| Item | United States | Japan | Korea | Taiwan |
|---|---|---|---|---|
| Headline (year on year) | 3.7% | 2.1% | 2.9% | 2.73% |
| Core (year on year) | 2.6% | ① 2.1% ② 2.4% | ① 2.7% ② 2.8% | 2.52% |
| October data release (KST) | Tuesday, November 10, 10:30 p.m. (8:30 a.m. ET) | Friday, November 20, 8:30 a.m. | Tuesday, November 3; no time in the release schedule | Thursday, November 5, 5 p.m. (4 p.m. Taiwan time) |
US CPI: three numbers to keep apart
CPI day delivers three numbers that measure different things. Here's how they appear at the top of the BLS September 2026 CPI release.
- Headline, month over month, +0.6%: seasonally adjusted.
- Headline, year over year, 3.7%: not seasonally adjusted.
- Core, year over year, 2.6%: not seasonally adjusted. This is the index excluding food and energy, up from 2.4% in August.
The two headline figures don't get the same seasonal treatment. BLS notes that with seasonally adjusted data, "some users find it easier to see the underlying trend in short-term price changes." For contract escalation, though, it writes: "we strongly recommend using indexes that are not seasonally adjusted." Mash both numbers into one sentence and that distinction disappears.
The same care applies when you cite core at 2.6%. The BLS text doesn't say whether that figure is seasonally adjusted. In Table A of the release, though, 2.6 sits in the "Unadjusted 12-mos." column. Core rose 0.3% month over month in September (seasonally adjusted), shown in the same table's seasonally adjusted monthly column.
Most US readers know core excludes food. It's easy to miss how much "food" covers. BLS reported that "the index for food was unchanged in September, as the index for food away from home increased 0.2 percent and the index for food at home fell 0.1 percent." The food index spans the grocery cart and the restaurant check. That's why core CPI drops dining out as well.
Why strip them out? The BLS CPI Questions and Answers page gives a short reason: "food and energy prices are relatively volatile."
The Fed's 2% goal runs on a different index. A Federal Reserve FAQ defines the target as "inflation of 2 percent over the longer run, as measured by the annual change in the price index for personal consumption expenditures." That's the all-items PCE index, food and energy included. Core CPI at 2.6% sits outside the Fed's target measure.
How far to trust core is debated even within the US. As BLS frames it, core filters out jumpy prices so the underlying trend shows through. A July 15, 2026 Reuters report (via WHBL), on the other hand, noted that core PCE leaves out about 13% of consumer spending. That also ends up "divorcing the measure from some of the most sensitive household costs like grocery bills," the report said. Reuters added that this is "a fact that many Fed policymakers agree is hard to explain or even justify when food costs are rising."
A St. Louis Fed blog post (July 15, 2026; not an official position of the bank) offered a middle path: "Excluding only energy goods like gasoline from headline PCE creates a smoother and more representative inflation measure."
Japan's "core" keeps energy in

When Japanese news outlets cite "core CPI," they mean the Statistics Bureau of Japan's index of all items excluding fresh food (生鮮食品を除く総合). The bureau, part of the Ministry of Internal Affairs and Communications, also publishes all items excluding fresh food and energy (生鮮食品及びエネルギーを除く総合), widely called "core-core." Neither nickname is official. The bureau uses the longer names.
"Fresh food" covers three groups: fresh fish and seafood, fresh vegetables and fresh fruit. A footnote in the bureau's September 2026 release sets the scope as 「生鮮魚介、生鮮野菜及び生鮮果物」. Meat falls outside that list, so it stays in core. So do energy items.
Japan's nationwide CPI stood at 102.2 in September 2026, with 2025 as the base of 100. That's up 2.1% from a year earlier, and core also rose 2.1%. The index that strips out energy as well actually ran higher, at 2.4%. We covered that 2.1% reading in PRISM 5 Things #4.
That's the opposite of the US pattern. In September, US core (2.6%) ran 1.1 percentage points below headline (3.7%). In Japan, removing energy as well pushed the number up 0.3 points.
The Bank of Japan's target isn't core, either. The 2013 joint statement by the government and the Bank of Japan sets it this way: 「物価安定の目標を消費者物価の前年比上昇率で2%とする」. In other words, the price stability target is a 2% year-on-year rise in consumer prices. The statement doesn't name core or core-core.
The base year has changed, too. Starting with July 2026 data (released August 21, 2026), Japan's CPI uses 2025=100. That's why September 2026 index levels sit around 102. Comparing them directly with index levels on the old base would be misleading. On August 7, 2026, the bureau published January 2025–June 2026 data recalculated on the new base, along with linked indexes. October data, due November 20, 2026, will be the fourth nationwide release on the new base.
Korea has two core measures
Korea's Ministry of Data and Statistics publishes two core-type indexes. On e-Narajipyo, the government's indicator portal, the ministry's indicator note calls the index excluding agricultural products and oil (농산물및석유류제외지수) one "close to core inflation." The other is the index excluding food and energy (식료품및에너지제외지수), which the ministry labels the "OECD method."
According to the same note, the agriculture-and-oil index removes agricultural products other than grains, plus petroleum products. It's built from the 401 items left out of 458 surveyed on the 2020 base. So grains like rice stay in. The food-and-energy index goes further, also removing fishery products, livestock products and energy. Because that definition removes energy "additionally," the agriculture-and-oil index still holds electricity and gas charges, the energy that isn't petroleum.
Here are the September 2026 numbers, as released by the ministry. The consumer price index stood at 120.43, up 2.9% from a year earlier. That's 0.2 percentage points below August's 3.1%. The agriculture-and-oil index rose 2.7%, and the food-and-energy index rose 2.8%. Month over month, the agriculture-and-oil index gained 0.2% while the food-and-energy index slipped 0.1%. Same month, two core gauges, opposite monthly moves.
The Bank of Korea ties its target to headline. The BoK says that since 2019, its inflation target has been 2% consumer price inflation on a year-on-year basis. September 2026's 2.9% headline is the number to hold against that target.
A rebasing is coming, too. September 2026 data still use 2020=100. According to a July 7, 2026 report by Korean news agency Newsis, the ministry plans to publish the results of its 2025-base revision on December 18, 2026. The provisional basket has 455 representative items, newly adding software subscriptions, smartwatches and EV charging fees. As of this writing, it isn't confirmed which month's data will first use the new base.
Taiwan builds core CPI in two steps
Taiwan constructs its core measure in two stages. DGBAS's September 2026 price release spells out the sequence. Excluding vegetables and fruit first gives an increase of 2.78%. Removing energy on top of that yields core CPI (核心CPI): 2.52%. Headline CPI rose 2.73% from a year earlier. Month over month, it rose 0.44%, or 0.17% after seasonal adjustment. The base is 2021=100, written as ROC year 110 under the Republic of China calendar used in Taiwan's official documents.
September shows how volatile vegetable prices can be. According to the same release, vegetable prices jumped 17.97% from August after heavy rain in late August. From a year earlier, they were up 4.93%. Fuel costs (油料費), an energy item, rose 12.72% year on year, tracking global oil prices. Core CPI excludes them. Airfares, up 13.83% year on year, aren't an energy item, so they stay in core.
Taiwan's Central Bank (CBC) uses the same definition. Its September 17, 2026 board resolution describes the January–August core CPI average of 2.11% as core CPI excluding vegetables, fruit and energy. The resolution contains no numerical target such as "2%." Instead, it cites price stability and financial stability as the bank's statutory mandates. The CBC raised its 2026 forecasts for CPI and core CPI inflation to 2.03% and 2.16%, respectively. That puts the core forecast 0.13 percentage points above headline. For 2027, it projects 1.83% and 1.89%.
The same number drew different readings. The Liberty Times (自由時報) and Central News Agency (CNA) described September's 2.73% as "above the 2% warning line for a fifth straight month" and "the highest in two and a half years." A DGBAS official, by contrast, told CNA the rise was 「溫和上漲」, or "mild." Broad-based inflation hasn't taken hold yet, the official explained. The "2% warning line" is a convention in Taiwanese media. We found no DGBAS or central bank document that sets it as an official threshold.
What to watch
All times are Korea Standard Time (KST, UTC+9), the same as Japan time.
November: October data from all four economies
- Tuesday, November 3 Korea's October consumer price trends. The Ministry of Data and Statistics' release schedule doesn't list a time.
- Thursday, November 5, 5 p.m. KST (4 p.m. Taiwan time) Taiwan's October prices. DGBAS announced the date in its September release.
- Tuesday, November 10, 10:30 p.m. KST (8:30 a.m. ET) US October CPI, per the BLS schedule. US daylight saving time ends November 1, so the gap with Korea widens to 14 hours.
- Friday, November 20, 8:30 a.m. KST Japan's October CPI (e-Stat release calendar), nationwide index.
December: Korea's rebasing
- December 18 Planned release of Korea's 2025-base revision results (Newsis, July 7, 2026). As of late October 2026, the month the new base takes effect is unconfirmed.
Here are the September 2026 baselines to compare against October's numbers.
- US: core 2.6%, a 1.1-point gap with headline (3.7%)
- Japan: core 2.1%, excluding fresh food and energy 2.4%
- Korea: excluding agricultural products and oil 2.7%, excluding food and energy 2.8%
- Taiwan: core CPI 2.52%, CBC's 2026 core CPI forecast 2.16%
This content is AI-generated based on source articles. While we strive for accuracy, errors may occur. We recommend verifying with the original source.
Related Articles

In July, PRISM relayed Epoch AI's call that Big Tech free cash flow would hit zero in Q3 2026. SEC filings show -$31.8 billion as AI capex ran ahead of trend.

The Fed held 10-2 and the BOJ 8-1. US Q3 growth hit a 3.4% annual rate, with September PCE inflation at 3.6%. Samsung's chip unit earned 106.5 trillion won.

South Korea's Q3 GDP grew 1.0%. Exports added 1.1pp, imports took 1.0pp, leaving net exports at 0.1pp. Equipment investment and GDI rose; consumption fell.
Taiwan covers about 34.6¢ and Japan 27.1¢ per liter of gasoline (PRISM calculation), while Korea's refiners pay first and await settlement. Five countries, five bills.
In July, PRISM relayed Epoch AI's call that Big Tech free cash flow would hit zero in Q3 2026. SEC filings show -$31.8 billion as AI capex ran ahead of trend.
The Fed held 10-2 and the BOJ 8-1. US Q3 growth hit a 3.4% annual rate, with September PCE inflation at 3.6%. Samsung's chip unit earned 106.5 trillion won.
South Korea's Q3 GDP grew 1.0%. Exports added 1.1pp, imports took 1.0pp, leaving net exports at 0.1pp. Equipment investment and GDI rose; consumption fell.
Taiwan covers about 34.6¢ and Japan 27.1¢ per liter of gasoline (PRISM calculation), while Korea's refiners pay first and await settlement. Five countries, five bills.
Thoughts
Share your thoughts on this article
Sign in to join the conversation