AI Can Handle 5-Hour Tasks Now. But What Does That Actually Mean?
METR's viral AI capability graph shows exponential progress, but the reality behind the dramatic numbers is far more complex than it appears.
Five hours. That's how long it would take a human to complete tasks that Anthropic's latest AI model, Claude Opus 4.5, can now handle. When this number dropped in December, it sent shockwaves through the AI community. One Anthropic safety researcher announced he'd change his research direction. Another simply tweeted: "mom come pick me up i'm scared."
The source of this drama? A now-iconic graph from METR, an AI research nonprofit whose exponential trend line has become the most watched metric in AI since its March 2024 debut. But as breathless reactions pile up, a more nuanced story emerges—one that reveals as much about our relationship with AI hype as it does about AI capabilities themselves.
The Graph Everyone's Talking About
METR's plot tracks what they call "time horizons"—a measure of how long it takes humans to complete tasks that AI models can successfully handle 50% of the time. The trend is undeniably striking: every seven months or so, this capability doubles. Models that could handle 9-second human tasks in mid-2020 progressed to 4-minute tasks by early 2023, and 40-minute tasks by late 2024.
Claude Opus 4.5's apparent jump to 5-hour tasks seemed to outpace even this exponential trend, though METR cautioned the actual range could be anywhere from 2 to 20 hours. That uncertainty didn't stop the AI community from treating it as a watershed moment.
Sydney Von Arx, a member of METR's technical staff, watches these reactions with mixed feelings. "There are a bunch of ways that people are reading too much into the graph," she says. The organization finds itself in the peculiar position of having created one of AI's most influential metrics while constantly trying to correct misinterpretations of it.
What Time Horizons Actually Measure
The confusion starts with what "5 hours" actually means. It's not that the AI can work independently for five hours—a common misreading that Thomas Kwa, one of the graph's creators, has seen so often he addressed it at the top of a recent blog post. Instead, it means the AI can complete tasks that take humans about five hours to finish.
To calculate these time horizons, METR assembled a collection of coding tasks ranging from quick multiple-choice questions to detailed programming challenges. Human experts attempted most tasks, establishing baseline completion times. When AI models tackled the same suite, researchers found they excelled at quick tasks but struggled as human completion times increased. The point where models succeeded on 50% of tasks became their "time horizon."
This methodology raises questions. Inioluwa Deborah Raji, a PhD student at UC Berkeley studying model evaluation, points out: "I don't think it's necessarily a given fact that because something takes longer, it's going to be a harder task." Time doesn't always correlate with difficulty—a insight that complicates the graph's apparent precision.
The Coding Caveat
METR's focus on coding tasks creates another limitation. "A model can get better at coding, but it's not going to magically get better at anything else," notes Daniel Kang, an assistant professor at the University of Illinois Urbana-Champaign. The graph's dramatic trajectory tells us about AI progress in software engineering, not AI capabilities broadly.
This matters enormously for interpreting what the trends mean. A model with a one-hour time horizon might automate some programming tasks, but that doesn't translate to replacing human workers across industries. Even within coding, the controlled test environment differs vastly from real-world software development's messiness and ambiguity.
METR acknowledges this limitation. In their original study, they quantified task "messiness" based on factors like whether models knew exactly how they'd be scored or could easily restart after mistakes. Models performed worse on messier tasks, though the overall improvement pattern held.
Investment Implications and Market Reactions
Despite these caveats, the graph has become a cornerstone of AI investment thesis. Sequoia Capital recently published "2026: This is AGI," using METR's plot to argue that AI capable of acting as employees or contractors will soon arrive. "The provocation really was like, 'What will you do when your plans are measured in centuries?'" says Sonya Huang, a general partner at Sequoia and one of the post's authors.
This interpretation exemplifies how METR's careful scientific work gets transformed into bold market predictions. The graph appeared prominently in "AI 2027," a viral sci-fi story forecasting superintelligent AI by 2030. As Von Arx puts it: "It's a little weird when the way lots of people are familiar with your work is this pretty opinionated interpretation."
The Hype Machine Problem
Kwa isn't optimistic that METR's efforts to clarify limitations will meaningfully shift discourse. "I think the hype machine will basically, whatever we do, just strip out all the caveats," he says. The organization is working on a more extensive FAQ document, but they're fighting against powerful incentives for dramatic interpretation.
Even critics acknowledge METR's methodological rigor. Gary Marcus, a former NYU professor and prominent LLM skeptic, described much of the work as "terrific" while questioning broader interpretations. Kang calls it "one of the most carefully designed studies in the literature for this kind of work."
Authors
Related Articles
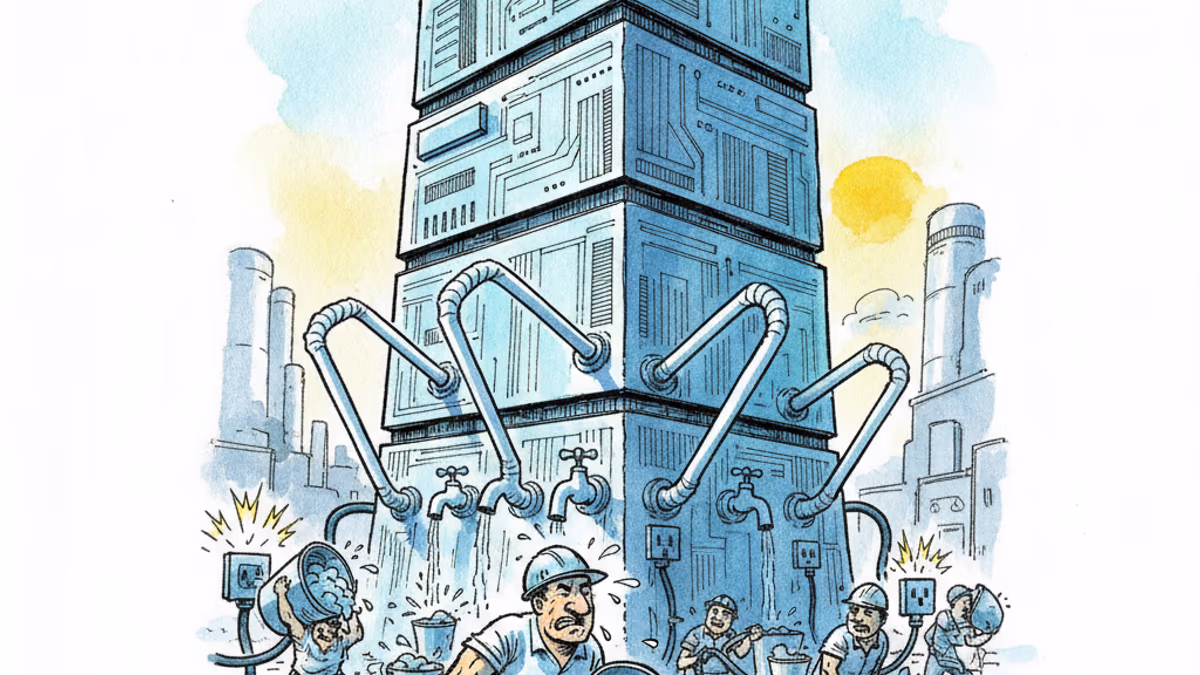
Samsung and SK unveiled a chip and AI investment package worth thousands of trillions of won on June 29. The headline number swings wildly by outlet, but the real contest isn't capital — it's water and power.
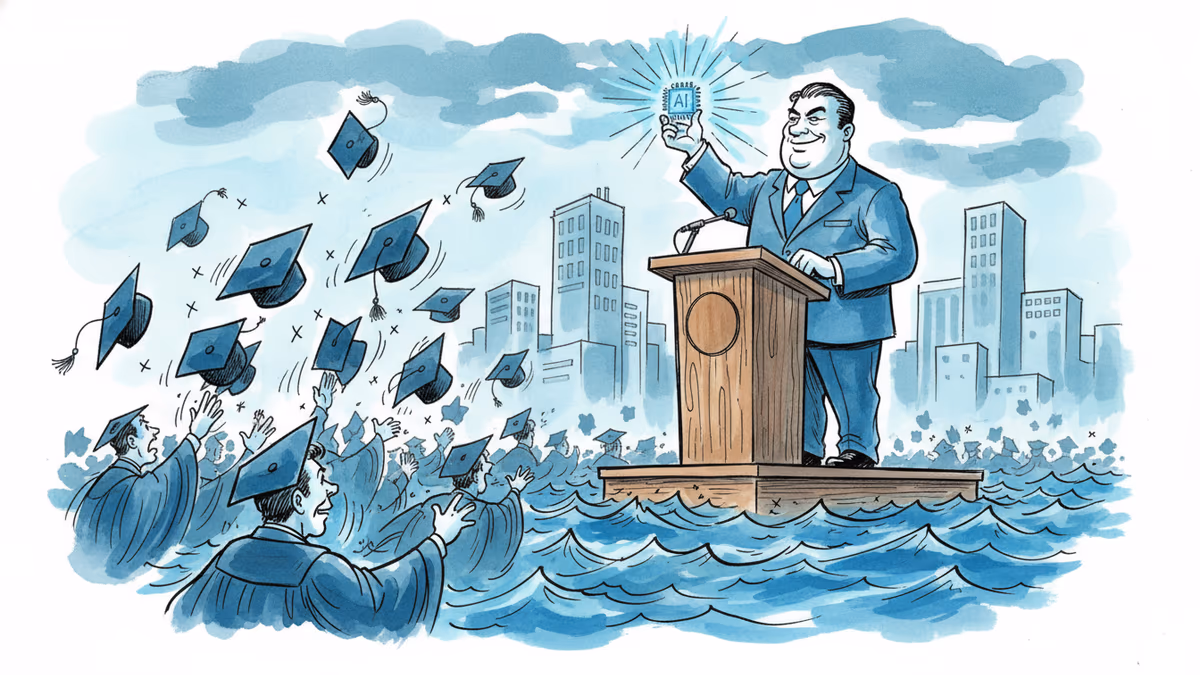
Viral videos show 2026 graduates jeering executives who praise AI at commencement ceremonies. It's not just rudeness — it's a signal about who pays for technological optimism.
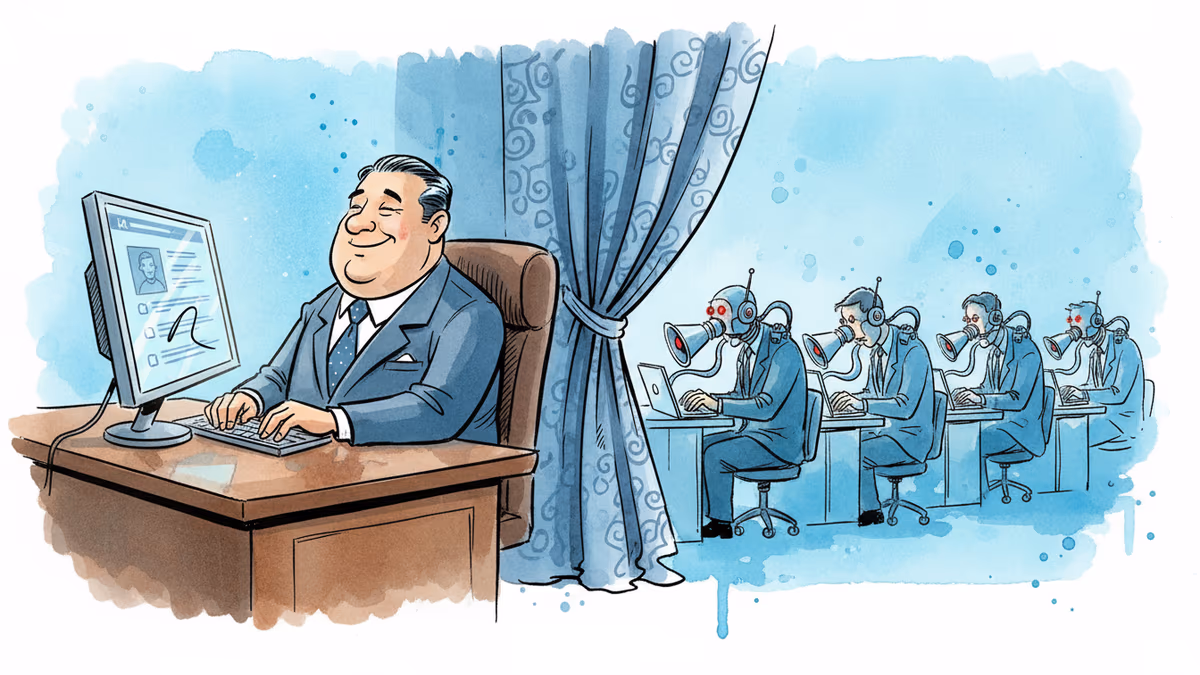
Filipino virtual assistants using AI to ghost-manage LinkedIn profiles for executives is now a structured industry. 30 comments a day, fake engagement rings, and a platform struggling to tell real from fabricated.
Two commencement speakers learned the hard way that AI enthusiasm doesn't land well with today's graduates. The backlash reveals a widening gap between tech optimism and Gen Z's economic reality.
Samsung and SK unveiled a chip and AI investment package worth thousands of trillions of won on June 29. The headline number swings wildly by outlet, but the real contest isn't capital — it's water and power.
Viral videos show 2026 graduates jeering executives who praise AI at commencement ceremonies. It's not just rudeness — it's a signal about who pays for technological optimism.
Filipino virtual assistants using AI to ghost-manage LinkedIn profiles for executives is now a structured industry. 30 comments a day, fake engagement rings, and a platform struggling to tell real from fabricated.
Two commencement speakers learned the hard way that AI enthusiasm doesn't land well with today's graduates. The backlash reveals a widening gap between tech optimism and Gen Z's economic reality.
Thoughts
Share your thoughts on this article
Sign in to join the conversation