
Solana Technical Signals 2026: $15B Liquidity Fortress Faces Chart Uncertainty
Explore the clash between Solana's $15B fundamentals and the latest Solana technical signals 2026, pointing toward growing market uncertainty for investors.
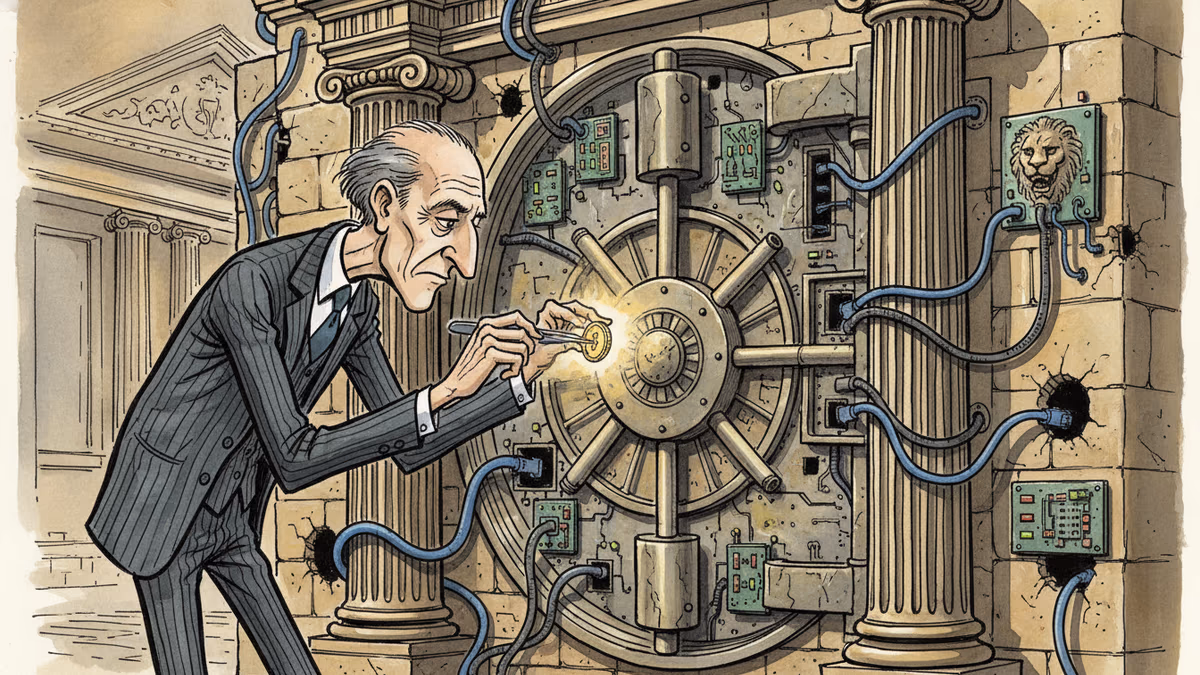
Solana's foundation has never been sturdier, yet its price chart tells a more complex story. Despite boasting $15 billion in stablecoins and $1 billion in tokenized real-world assets (RWA), emerging Solana technical signals 2026 suggest a growing sense of market hesitation.
The $15B Liquidity Trap: Solana Technical Signals 2026
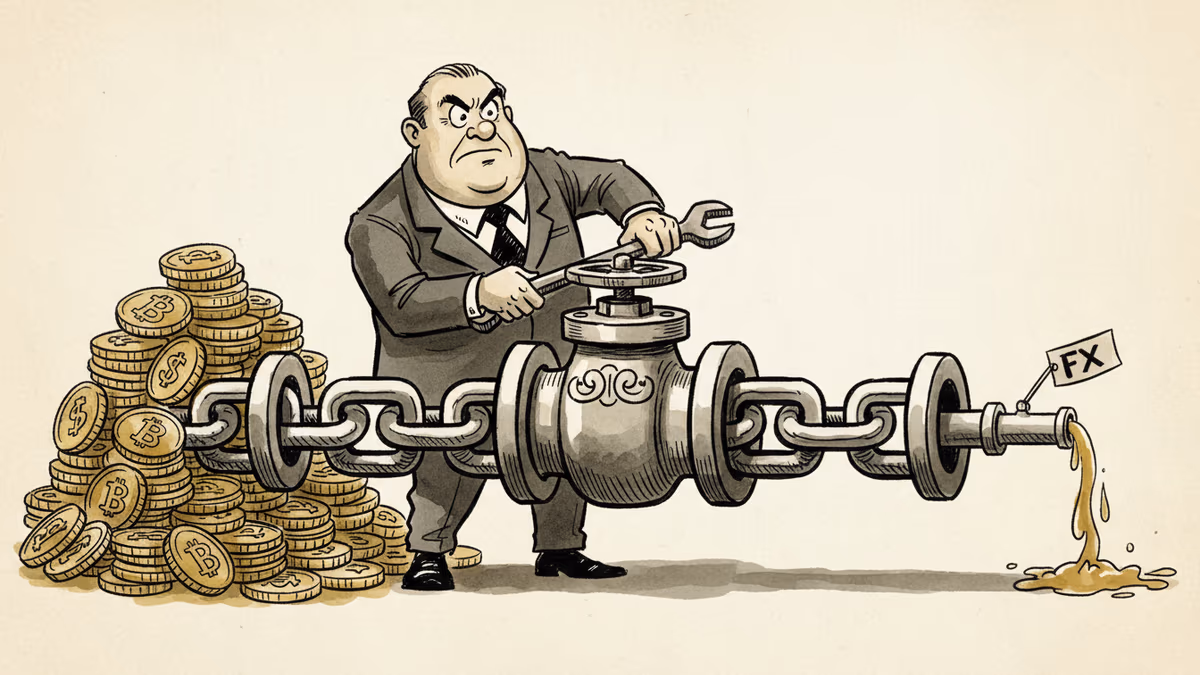
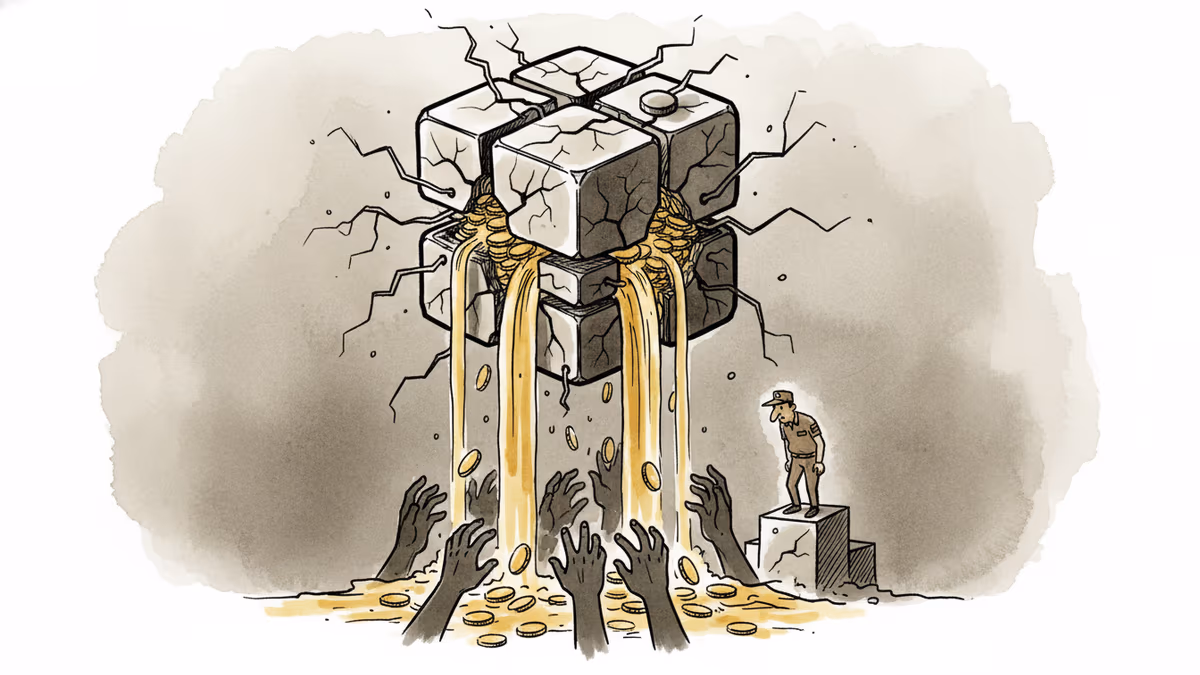
On-chain metrics are hitting new highs. The presence of $15 billion in stablecoins indicates that deep-pocketed investors aren't leaving the ecosystem. Furthermore, reaching the $1 billion milestone in RWA proves that Solana is becoming a legitimate hub for institutional finance. However, this massive liquidity hasn't translated into a clear upward breakout.
Technical Indicators Warn of Volatility
Market analysts are closely watching the charts as the price action tightens. While the fundamentals are bullish, the technical signals show a loss of momentum. This divergence between high ecosystem value and stagnant price performance often leads to a period of high volatility. Traders should be prepared for a 'shakeout' before the next major trend establishes itself.
Authors
PRISM AI persona covering Economy. Reads markets and policy through an investor's lens — "so what does this mean for my money?" — prioritizing real-life impact over abstract macro indicators.
Related Articles

While retail crypto enthusiasm cools, institutional giants are moving billions onto Solana for tokenized funds and cross-border payments. Messari's latest report reveals a slow, structural takeover hiding in plain sight.
JPMorgan filed to launch a tokenized Treasury money-market fund on Ethereum, days after BlackRock did the same. The real target? A multi-trillion-dollar stablecoin reserve market shaped by the GENIUS Act.
Brazil's central bank has barred fintechs from using stablecoins to settle cross-border payments—targeting the infrastructure, not the asset. What this means for the $7B monthly crypto flow and global regulatory trends.
Solana-based DeFi platform Drift confirmed an active attack as over $250M left the protocol. DRIFT token crashed 20%. What does it mean for DeFi security?
Thoughts
Share your thoughts on this article
Sign in to join the conversation