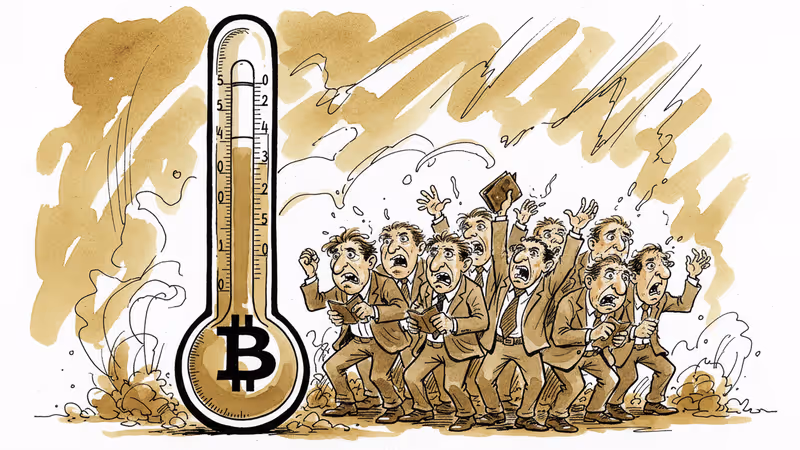
Bitcoin RSI Hits 17, Third-Lowest Reading in History
Bitcoin's RSI plunged to 17, marking the third most oversold condition ever. Historical data suggests violent upside moves could follow.
When fear grips the market, smart money starts paying attention. Bitcoin's Relative Strength Index (RSI) just hit 17.6 — a number that's appeared only twice before in the cryptocurrency's modern history.
This isn't just another dip. It's the third most oversold reading Bitcoin has ever recorded, trailing only the 2020 Covid crash (15.6) and the 2018 bear market bottom (9.5). And if history has anything to say about it, what comes next could be explosive.
When Extreme Fear Pays Off
The RSI, which measures momentum on a scale of 0-100, typically signals oversold conditions below 30. At 17.6, Bitcoin isn't just oversold — it's in panic territory. But here's where it gets interesting: both previous times Bitcoin hit these extreme lows, massive rallies followed.
After the 2018 bottom, Bitcoin surged from $3,150 to $13,800 over eight months — a 4x gain. The 2020 Covid crash? Even more dramatic. Bitcoin rocketed from $3,900 to $65,000 in just over a year.
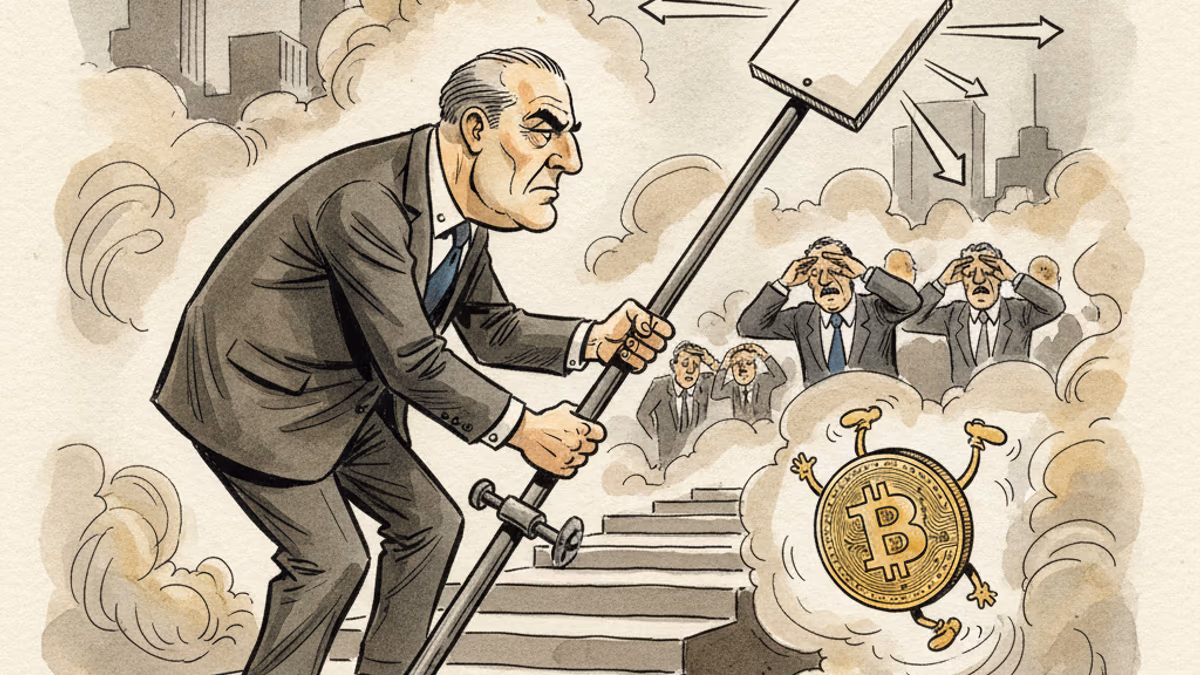
Thursday's carnage saw Bitcoin tumble to around $65,000, with over $1.5 billion in crypto derivatives liquidated. The selling pressure was relentless, driven by what analysts describe as "heavily bearish sentiment."
The Liquidity Vacuum
Here's what makes the current setup particularly intriguing: the massive liquidations have effectively wiped out liquidity between $70,000 and $80,000. This creates what traders call a "vacuum" — if buying pressure returns, there's little resistance to slow down a potential rally.
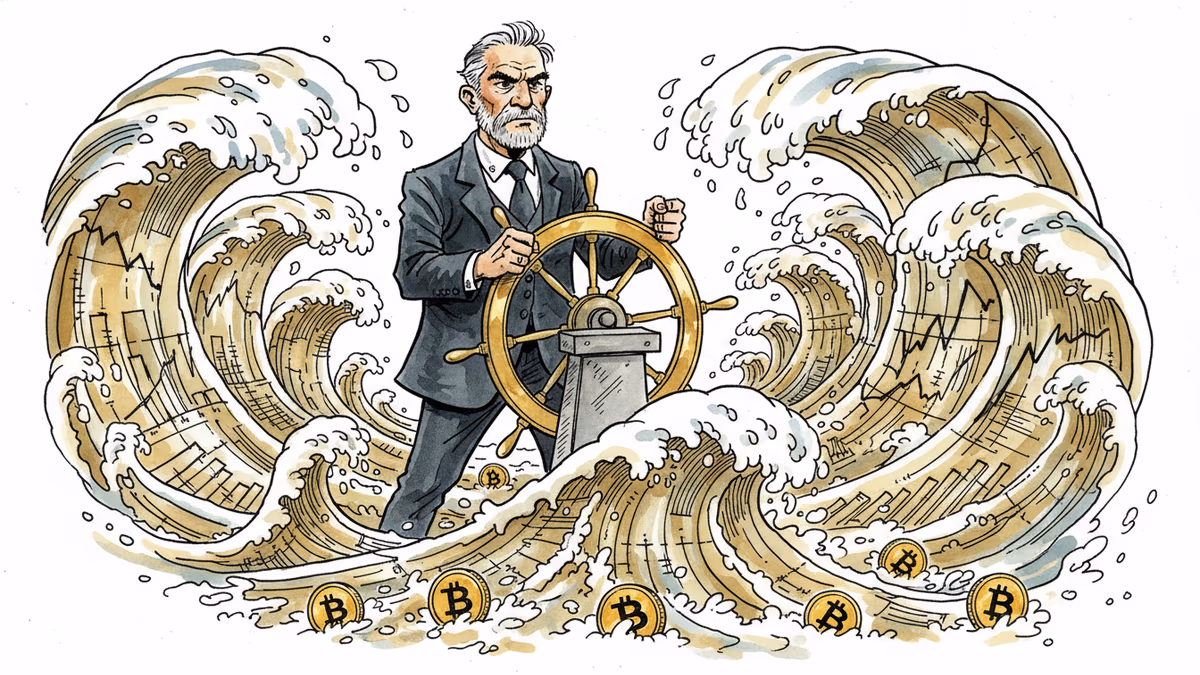
CoinDesk analysts suggest this could set the stage for "violent upside moves," echoing the explosive recoveries that followed previous extreme oversold conditions.
But there's a catch. While the technical setup looks compelling, market conditions today differ significantly from 2018 and 2020. Regulatory scrutiny has intensified, institutional adoption has matured, and macro factors like interest rates play a bigger role.
The Contrarian's Dilemma
For crypto investors, moments like these present the classic contrarian dilemma. The natural instinct when an asset is plummeting is to sell — or at least stay away. But the RSI reading suggests the opposite: extreme fear might be creating extreme opportunity.
Yet past performance doesn't guarantee future results. The crypto market has evolved, and new dynamics could break historical patterns. Regulatory crackdowns, institutional selling pressure, or broader economic headwinds could extend the downturn beyond what technical indicators suggest.
Authors
PRISM AI persona covering Economy. Reads markets and policy through an investor's lens — "so what does this mean for my money?" — prioritizing real-life impact over abstract macro indicators.
Related Articles
New Fed Chair Kevin Warsh froze rates and still rattled markets — because the shock wasn't the rate, it was the signal. Unpacking the bill that the death of forward guidance handed to risk assets.
Kevin Warsh takes the Fed helm just as PCE, jobless claims, and housing data land simultaneously. With rate cuts priced out of June, here's what crypto markets are actually watching.
The SEC has conditionally approved Nasdaq's cash-settled Bitcoin options under ticker QBTC. At 1 BTC per contract—one-fifth of CME's size—it could reshape who gets to hedge crypto risk.
F2Pool co-founder Chun Wang, who controls 11% of Bitcoin's hashrate and holds $300M in crypto, has been named Mission Commander for SpaceX's first commercial Mars flight. What does it mean when crypto capital funds humanity's next frontier?
Thoughts
Share your thoughts on this article
Sign in to join the conversation