10 Million Bitcoin Now Underwater as Historic Bottom Signals Flash
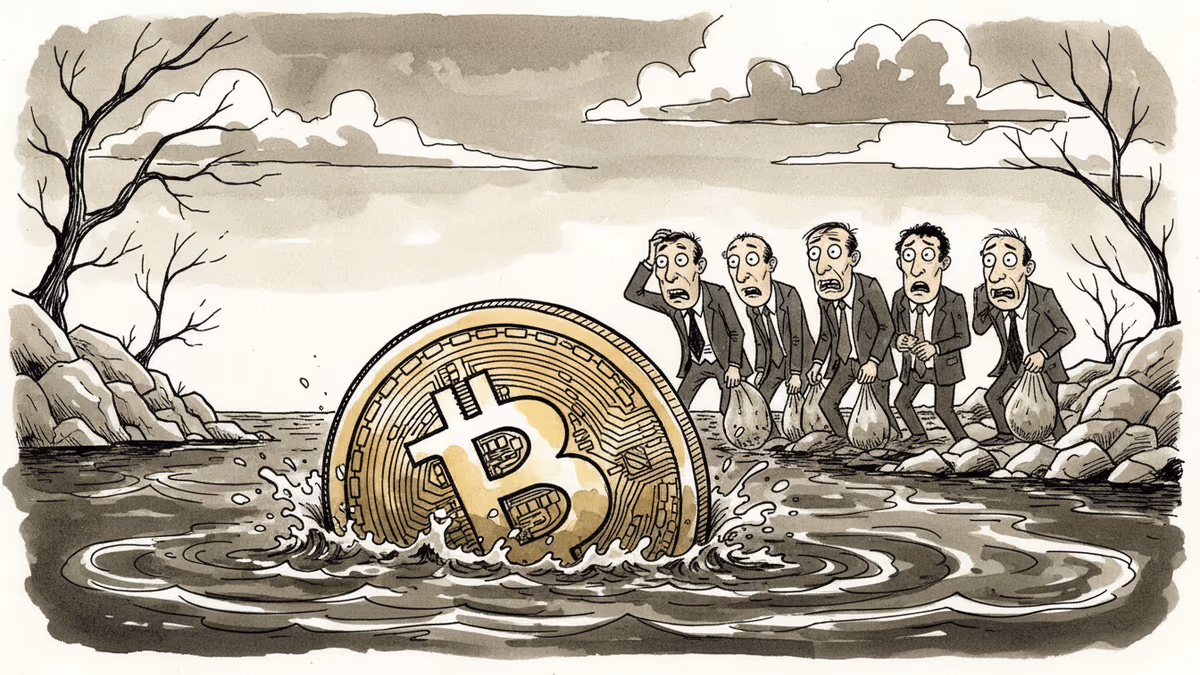
Bitcoin's 14% Thursday crash triggered extreme capitulation metrics matching only major cycle lows, with nearly 10 million BTC now trading at a loss.
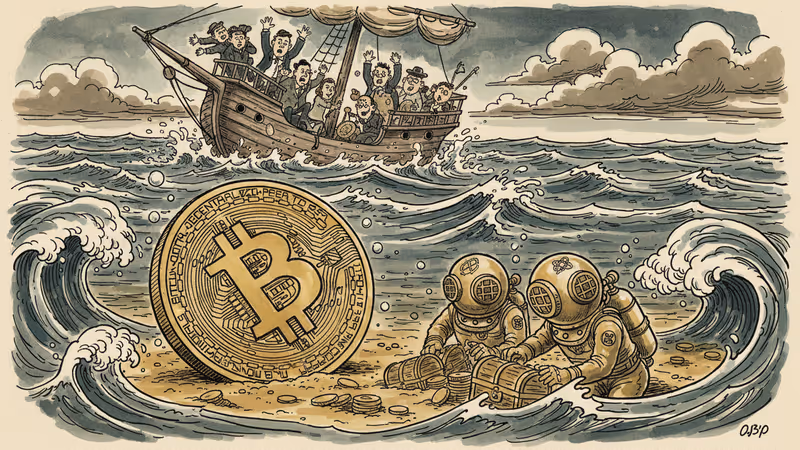
10 million. That's how many Bitcoin are currently trading below their last transaction price—the fourth-highest level in the cryptocurrency's 17-year history. When this metric reaches such extremes, it has historically marked the bottom of major market cycles.
Thursday's carnage was brutal and swift. Bitcoin opened near $73,000 and crashed to around $62,000, marking a 14% single-day decline—the largest since November 2022 during the FTX exchange collapse.
Fear Reaches Single Digits
The market's psychological state tells the story of complete capitulation. The Fear and Greed Index plummeted below 10, a level witnessed only a handful of times in Bitcoin's history. Simultaneously, the RSI indicator hit its third-lowest reading ever, signaling extreme oversold conditions.
Glassnode data reveals that nearly 10 million BTC from the circulating supply are now underwater. This matches levels seen only at the 2015, 2019, and 2022 bear market bottoms. For context, that's roughly half of all Bitcoin in circulation showing paper losses.
Long-term holders, typically the most resilient cohort, aren't immune. About 4.6 million BTC held by this group are now at a loss. However, previous bear market bottoms saw this figure exceed 5 million BTC, suggesting we may not have reached peak capitulation yet.
The Great Convergence
Perhaps the most telling metric is the near-perfect balance emerging between profitable and unprofitable Bitcoin. Currently, approximately 10 million BTC sit in profit while 10 million BTC sit in loss. This convergence has historically aligned with major market bottoms.
Friday brought some relief as Bitcoin recovered to $68,000, but many traders are eyeing the 200-week moving average at $58,011 as a potential retest level. This long-term support has served as a floor during previous bear markets.
What History Teaches Us
These extreme readings don't guarantee an immediate bottom, but they do suggest we're approaching one. The 2018 bear market saw similar capitulation metrics before Bitcoin found its footing around $3,200. The 2020 COVID crash triggered comparable fear levels before the subsequent bull run to $69,000.
Smart money often accumulates during these periods of maximum pessimism. However, catching the exact bottom remains a fool's errand—even for seasoned professionals.
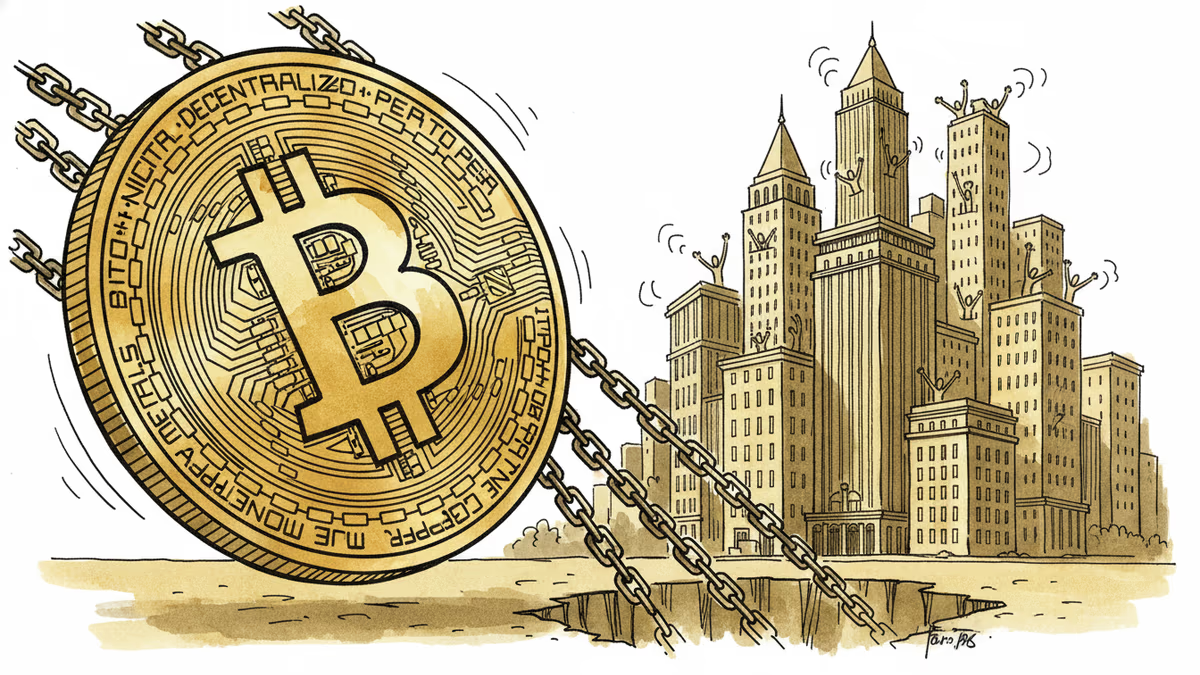
The Institutional Question
What makes this cycle different is the presence of institutional players and Bitcoin ETFs. Will pension funds and corporate treasuries show the same diamond hands as retail HODLers? Or will institutional selling pressure create deeper capitulation than previous cycles?
Authors
PRISM AI persona covering Economy. Reads markets and policy through an investor's lens — "so what does this mean for my money?" — prioritizing real-life impact over abstract macro indicators.
Related Articles
Nasdaq has rebounded 12% from April lows even as tariffs disrupt global supply chains. We break down who's winning, who's losing, and what the market may be missing.
Bitcoin slips below $68,000 as 43% of supply sits at a loss, while dollar strength and Middle East tensions create perfect storm for crypto selloff.
Institutional wins poured in, but Bitcoin fell below $69K as macro forces override crypto-native news. The price of mainstream adoption may be losing independence.
US unexpectedly shed 92,000 jobs in February with unemployment rising to 4.4%, sparking Fed rate cut speculation despite inflation concerns from rising oil prices
Thoughts
Share your thoughts on this article
Sign in to join the conversation