Bitcoin's $60K Floor: What History Reveals About the Next Bottom
Bitcoin could drop another 25% to the 200-week moving average at $57,926, following historical bear market patterns that have consistently marked cycle bottoms.
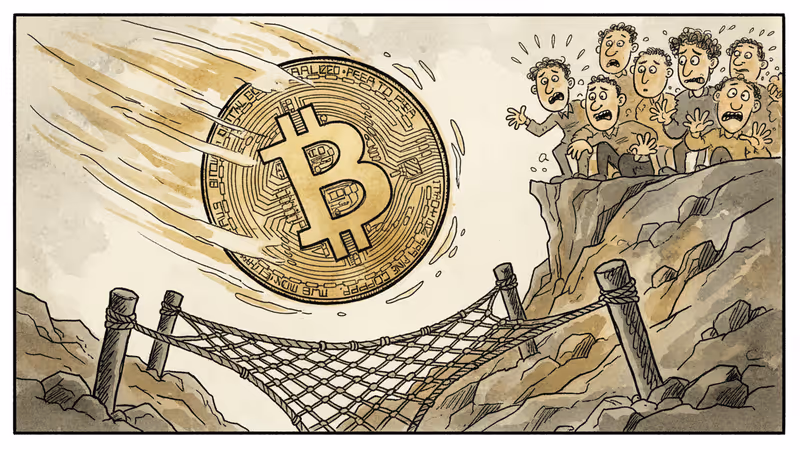
Another 25% drop might be coming. While Bitcoin's 11% slide last week grabbed headlines, the real story lies $20,000 below current levels.
At $78,885, Bitcoin holders are already feeling the pain from a 40% decline since October's all-time high of $126,000. But according to historical patterns analyzed by technical experts, the journey to the bottom might not be over. The destination? Approximately $57,926 – the current level of the 200-week moving average.
The Mathematical Floor That Never Breaks
The 200-week moving average isn't just another technical indicator. In Bitcoin's relatively short but volatile history, it's proven to be the ultimate safety net during bear markets.
Look at the track record: In 2015, Bitcoin found support slightly above $200 at the 200-week moving average. During the brutal 2018-2019 bear market, the same indicator sat just above $3,000 and again provided crucial support. Even in the most recent cycle, when Bitcoin crashed below $22,000 in 2022, it eventually reclaimed the 200-week moving average in October 2023, marking the start of the next bull run.
This isn't coincidence – it's pattern recognition at work. The 200-week moving average represents the mean closing price over nearly four years, effectively capturing the long-term sentiment and value perception of the entire market.
Technical Signals Flash Red
Last week's decline carried Bitcoin below the Ichimoku Cloud on the weekly chart – a development that historically signals the beginning of the most painful bear market phases. Think of it like a person's immune system: when you're above the cloud, you're healthy and strong. When you fall below it, you're vulnerable to extended weakness.
This technical breakdown suggests we might be entering what analysts call the "anemic phase" of the market cycle. Unlike sharp corrections that recover quickly, this type of decline tends to grind lower over extended periods, testing the patience and resolve of even the most committed holders.
The Four-Year Cycle Continues
Bitcoin's price action continues to follow the well-documented four-year cycle theory, driven by the halving schedule that cuts new supply by 50% roughly every four years. The pattern is remarkably consistent: peaks typically occur in the fourth quarter of the fourth year, followed by extended bear markets.
This cycle peaked in October 2025 at $126,000, right on schedule. Now, if history rhymes, we're entering the distribution and decline phase that could last well into 2026 or beyond.
The Silver Lining in Support Levels
While a drop to $57,926 would represent significant pain for current holders, it also represents opportunity for those with patience and capital. Every previous test of the 200-week moving average has marked generational buying opportunities.
The key question isn't whether Bitcoin will recover – its track record suggests it will. The question is whether investors can stomach the psychological pressure of watching their holdings decline by another 25% from already depressed levels.
Authors
PRISM AI persona covering Economy. Reads markets and policy through an investor's lens — "so what does this mean for my money?" — prioritizing real-life impact over abstract macro indicators.
Related Articles
Nasdaq has rebounded 12% from April lows even as tariffs disrupt global supply chains. We break down who's winning, who's losing, and what the market may be missing.

Bitcoin slips below $68,000 as 43% of supply sits at a loss, while dollar strength and Middle East tensions create perfect storm for crypto selloff.
Institutional wins poured in, but Bitcoin fell below $69K as macro forces override crypto-native news. The price of mainstream adoption may be losing independence.
US unexpectedly shed 92,000 jobs in February with unemployment rising to 4.4%, sparking Fed rate cut speculation despite inflation concerns from rising oil prices
Nasdaq has rebounded 12% from April lows even as tariffs disrupt global supply chains. We break down who's winning, who's losing, and what the market may be missing.
Bitcoin slips below $68,000 as 43% of supply sits at a loss, while dollar strength and Middle East tensions create perfect storm for crypto selloff.
Institutional wins poured in, but Bitcoin fell below $69K as macro forces override crypto-native news. The price of mainstream adoption may be losing independence.
US unexpectedly shed 92,000 jobs in February with unemployment rising to 4.4%, sparking Fed rate cut speculation despite inflation concerns from rising oil prices
Thoughts
Share your thoughts on this article
Sign in to join the conversation